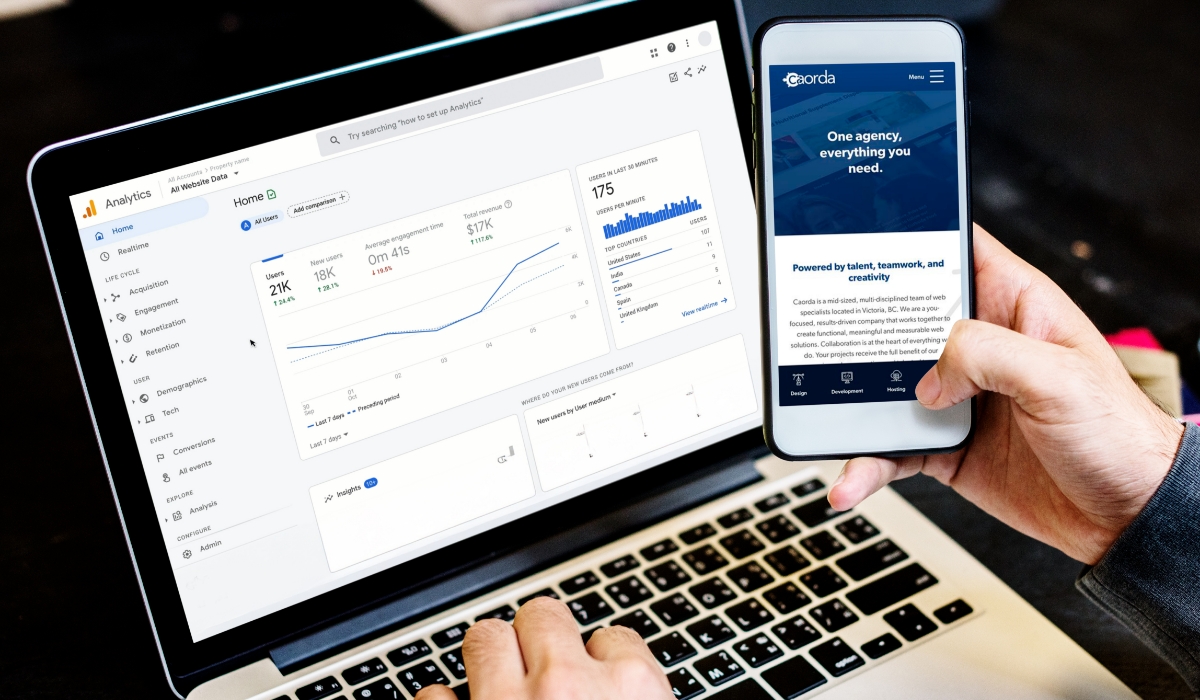
Google Analytics is the most powerful data and analytics tool available for free. Built by Google, this platform reports on everything you can imagine, allowing website owners to understand their visitors and learn how they interact with websites.
If you haven’t already installed this free tool, learn more about the benefits of Google Analytics and contact your website developer to get it set up quickly. It only takes a few minutes.
With all of this data at your fingertips, nothing can get in the way of you and your business goals. The trick is being able to make sense of the data. Because, as you’ll find, there’s a lot going on in the most recent version of Google Analytics. In this article, we’ll walk you through the reporting world of Google Analytics, explain important terms and concepts, and give you insight into your customers’ journey online.
Navigating Google Analytics
The most recent version of Google Analytics, also known as GA4, was released in late 2020. By the summer of 2023, Google implemented a mandatory transition away from the old version. This caused a bit of confusion and left some data in the dust for unknowing website owners, but GA4 is all that matters today.
The key difference between GA4 and the old version is how data is tracked. GA4 is event-based, while the old version was session-based. More on sessions and events later on… The important news is that GA4 tracks user interactions with better measurement capabilities and machine learning.
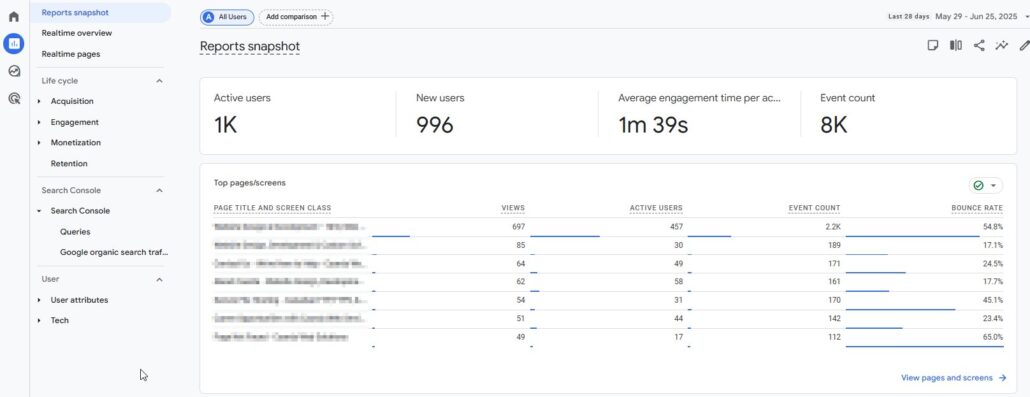
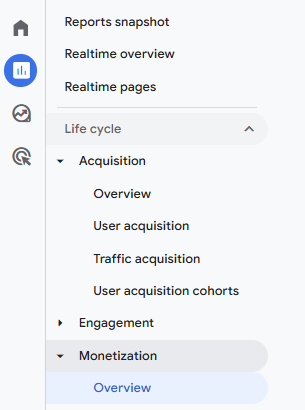
When you login to GA4, just about everything you’ll need will be found within the ‘Reports’ tab of the left-hand main menu. From this tab, a more detailed menu will appear. At the top you’ll be able to access a snapshot along with real-time data. By default, you’ll likely be looking at the ‘Reports snapshot’ first.
*Depending on which business objective you selected when creating your Google Analytics account, your reporting navigation may look different. Various reporting templates will feature different default screens and different navigation labels in the left-hand menu.
The bulk of the reporting power comes from the ‘Life cycle’ section below, which includes these 3 elements:
- Acquisition: This is how your visitors find your website, and where they come from.
- Engagement: This is what happens after a visitor arrives. Where do they go and what are they up to?
- Monetization: If you sell things on your website, this section will help you make sense of purchases, checkout journeys, and how much money your website is producing.
Below the ‘Life cycle’ tab in the left-hand menu, you’ll also notice a ‘User’ dropdown item. This will be another area of GA4 that’s definitely worth getting to know. In here, you have the chance to learn about your users, including where in the world they came from, along with which devices, operating systems, and browsers they use.
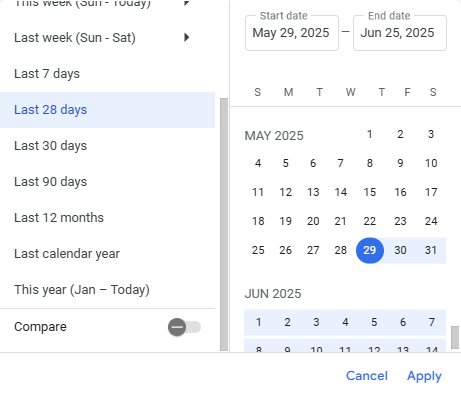
At any time, as you’re exploring the different reports in GA, remember you can always adjust the timeframe in the top right corner. Using this date picker tool, you can also toggle the ‘Compare’ option at the bottom to select some comparison dates.
Who is Visiting My Website (+ How)?
Google makes educated guesses when determining demographic details about who is visiting your website. It’s important to note that Google isn’t perfect. Ad blockers and virtual private networks (VPNs) are used to obscure data, making Google’s job a little more difficult.
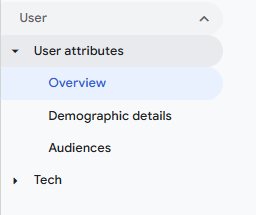
Demographic data can all be found in GA4 under ‘User’ in the left-hand menu. This is where you can dive deeper into who your users are, where they’re coming from and what kind of tech setup they’re using to reach you.
User Attributes Data
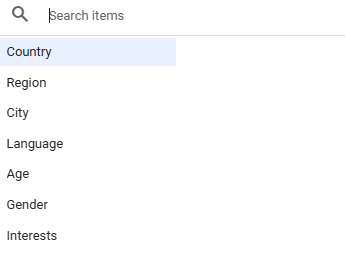
In the ‘Overview’ report under ‘User attributes’, you’ll be presented with a dashboard with a number of different reports. Here you can dive deeper to learn the cities and countries your users come from, along with data on gender, interests, language and age.
The ‘Demographic details’ report underneath the ‘Overview’ report in the menu provides a chart with recognizable metrics like users, sessions, engagement rate, event count and more. Using the little dropdown on top of the first column, you can toggle the dimension you’d like to zoom in on.
Visitor Devices
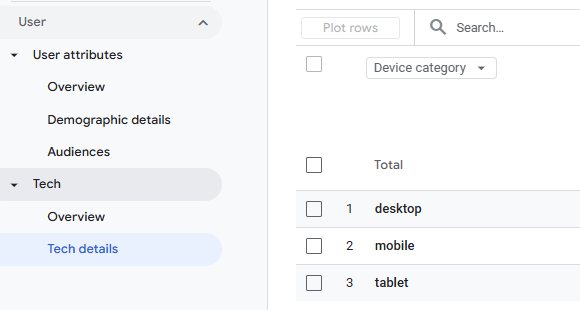
Under the ‘User attributes’ dropdown, the next menu item is ‘Tech’. Here you’ll find two reports – one ‘Overview’ and one ‘Tech details’ report. The ‘Overview’ presents a dashboard, while the ‘Tech details’ report shows a similar graph and chart. Here you’ll find familiar metrics plus a dropdown you can toggle at the top of the left column. The ‘Tech details’ report will give you insight into a range of details about your user, such as which device, operating system and browser they found your site with.
It’s important to remember that over time, the devices or your users will change. For example, most of your users might’ve been visiting your site from a desktop computer last year, but Smart TVs, tablets, or phones may be more popular next year. To ensure your website looks good on all devices, the design of your website should be responsive and focus on the most popular device used by your website visitors.
Filtering Data
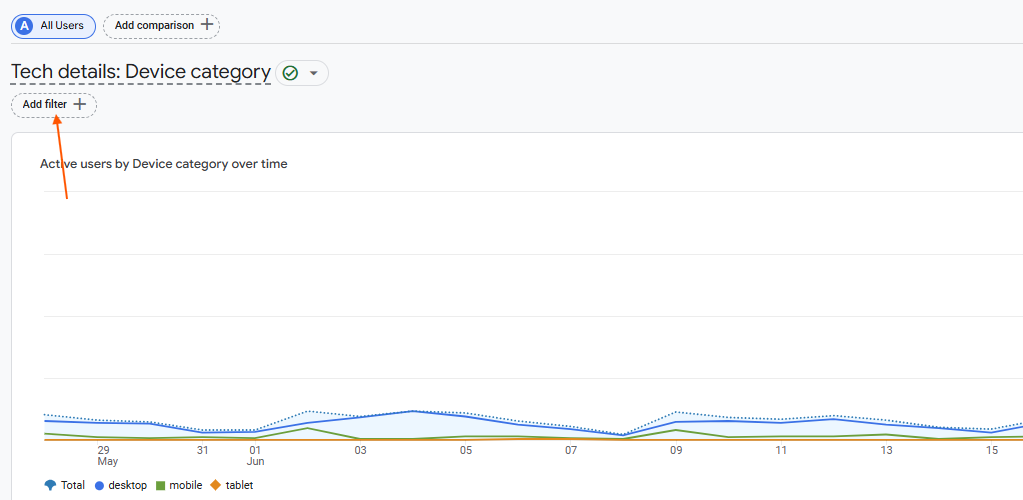
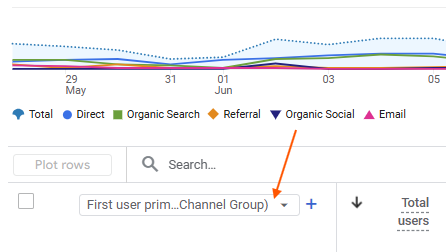
- If you ever want to filter the data to view just one dimension of data, like say only Organic Social, you can do so by clicking the little ‘Add filter’ button above the graph.
- The ‘Build filter’ window will open, and you’ll have the option to choose from many dimensions.
- If we want to isolate traffic by a certain source, select ‘first user default channel group’, found at the bottom of the scroll list.
- Alternatively, just typing ‘channel’ into the search field.
There are dozens of other dimensions to choose from, related to date and time, device, language, browser, age, pages, cities, and much more.
How Did My Visitors Find My Website?
The Customer Journey is Not a Straight Line
The customer journey refers to the path of interactions someone has with your brand, which includes all the searches, thoughts, clicks, decisions and views that person encounters.
In a perfect world, a user will think of something they need, search for it online, click on your website, and purchase the product right then and there. But this is rarely how things actually happen.
In a more likely scenario, people spend time visiting different websites, thinking about their options, and re-visiting the idea weeks later. Later on, they may see an email or an Instagram post that spurs them to check out your site again. Finally, after a nudge from their partner about how “we still need that thing”, your user returns a third time, this time clicking on a paid ad and finally completing a purchase after first checking out your blog and about page. Real customer journeys take time, along with many platforms, devices and ad networks.
Users vs. Sessions
A user is anyone who has logged at least one event on your website. That means they’ve visited your site. It may help to think of a user as an actual person – the same user could return to your site each day of the week, but it’s still the same user.
A session is just a website visit. That means the same user will have many different sessions over the course of their journey. And within each session, a user may also view many different pages (pageviews). For example, they may view 2 pages in their Monday morning session and 8 pages during their Wednesday night session.
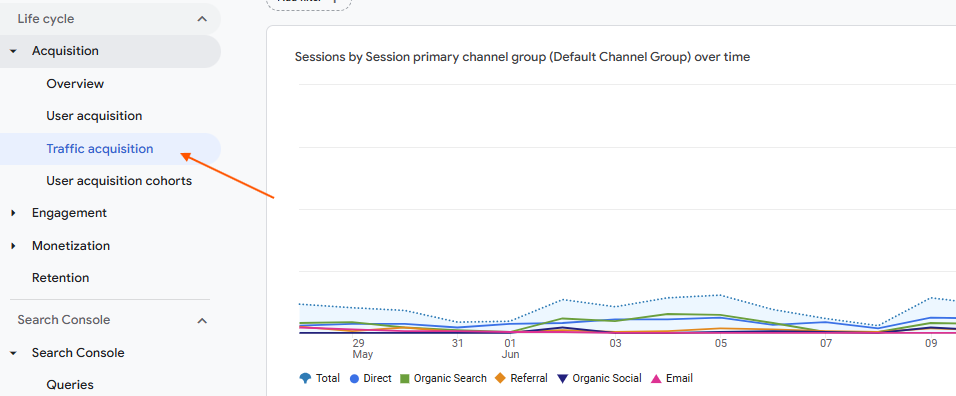
If you want to view session-specific data rather than user-specific data, navigate to ‘Traffic acquisition’ under the ‘Acquisition’ dropdown item under ‘Life cycle’. Here, you’ll find the data is similar to user-specific data, but focused on sessions rather than users.
Understanding Traffic Channels
Acquisition refers to where users come from prior to visiting your website. GA4 assigns user data into a handful of ‘channel groups’. There are others, but below are some of the more commonly used traffic channel groups:
- Organic Search: When a user types something into a search engine and clicks on an organic result.
- Direct: When a user finds a website while bypassing the search results, without the help of another website. Typically, this would be browser history or bookmarks.
- Paid Search: When a user types something into a search engine and clicks on an ad result.
- Organic Social: When a user finds a website from a social media channel.
- Email: When a user finds a website from an email.
- Organic Shopping: When a user finds a product or service in the organic shopping results of a search engine.
- Referral: When a user finds a website from another website.
- Paid Social: When a user finds a website from a paid ad on social media.
To take a look where your users come from, navigate to the ‘User acquisition’ option under the ‘Acquisition’ dropdown under ‘Life cycle’. Here, you’ll see data organized by default channel groups in the first column. This data is useful, but we can go a lot deeper.
Using the dropdown menu at the top of the first column, you can segment this data beyond just broad channel groups.
- First user medium: Similar to a default channel group, the first user medium is assigned at the user level and represents where a user started.
- First user source: This is the specific website from which a user came from.
- First user source/medium: This is a great way to see both the user source and medium to get a clear picture of where a user came from and the type of traffic.
Above are user-scoped dimensions. We also have all of the same dimensions for first sessions. So, just like we have first user medium and first user source, we also have access to session medium and session source. Remember, a session is just a website visit, and the same user will have many different sessions over the course of their journey.
If you want to view session-specific data rather than user-specific data, navigate one report lower to ‘Traffic acquisition’ under the ‘Acquisition’ dropdown item under ‘Life cycle’. Here, you’ll find the data is similar, but focused on sessions rather than users.
Understanding Data for Paid Ads
GA4 has the ability to integrate seamlessly with popular advertising platforms like Google and Meta. Custom events can be created in GA4 and imported into advertising platforms, and data from advertising platforms can be sent back to GA4 reports.
In the ‘User acquisition’ and ‘Traffic acquisition’ reports we covered previously, you can filter data that came strictly from paid ads. The default channel group for ads will be ‘Paid Search’, ‘Paid Social’, etc. And the medium for paid traffic will be ‘CPC’.
More detailed reporting for paid ads can be found under ‘Advertising’ in the left-hand menu. This is where you’ll find answers to the complicated concept of cross-network tracking.
Cross-Platform Tracking
Users will typically interact with a website multiple times through various methods in a given time period, and determining which parts of those paths get credit for a conversion is one of the more complicated aspects of digital marketing. For example, a user may first search for your organization on Google, visit your website, go to your Facebook page, and follow your page. Then later they might see a post from your page that leads back to your website, at which point they may take a desired action, like making a purchase.
Whether the Facebook post they clicked (last interaction) or their Google search for your organization (first interaction) gets credit for the desired action depends on the tracking system. There are also plenty of instances where users will visit a website on mobile and then later switch to a desktop device to complete a payment process, which also splits up the customer journey.
In GA4, a session is a specific individual visit to your website and is typically treated as the last interaction. A first user visit is the very first interaction a user had with your website within the time frame specified, and therefore is typically treated as a first interaction. Google Ads attributes partial credit to each step that involves an interaction with one of your ads somewhere along the way, while GA4 will attribute credit depending on what kind of filter or report you’re using.
Cross-Network Tracking
Cross-network tracking refers to a user interaction with an ad that can appear on multiple ad networks at once (typically Search and Display networks, simultaneously). xN refers to repeat touchpoints, like if a user searches your organization on Google and clicks a non-ad link to your website twice within the given time period. That’s what would be called Organic Search x 2.
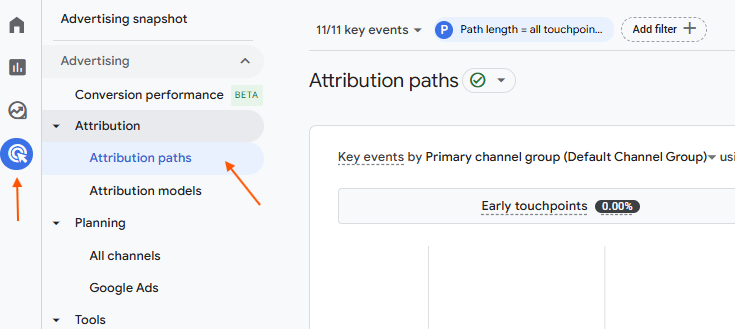
You can find cross-network reporting in GA4 under the ‘Conversion Paths’ or ‘Attribution Paths’ report under ‘Advertising’. By default, this report will show paths for all conversions. To see paths for a specific conversion, you can either sort the report by the ‘Purchase Revenue’ column, or click on the “_/_ conversion events” at the top and select only the conversion you want.
Determining which day conversions came from 100% paid or cross-network, or paths where paid or cross-network was the last interaction, is relatively simple since those should count as the session medium for that conversion. Conversions that came in from a path where paid or cross-network was an early interaction, and the final interaction that led to the donation was a non-paid channel, are a bit more complicated.
To view the data as a graph in GA4, you can go to the ‘Monetization overview’ report under ‘Monetization’ in the ‘Reports’ section of GA4 and use the “Add comparison” option to look at the CPC medium only.
What Are Users Doing on My Website?
Knowing how your users find your website is great, but what happens when they arrive? Are they finding what they’re looking for, or getting lost? GA4 data can help you understand.
Much of the reporting in GA4 is centred around some key terminology that you should familiarize yourself with if you haven’t already. You will find these terms in various sections of GA4, from engagement to acquisition.
- Users: A user is anyone who has logged an event on your website. So at the very least, they’ve visited your site. Think of a user as a person – it’s still the same person (or “user”) when they return to your site next week.
- New users: These are users who are visiting your site for the first time.
- Returning users: These are users who have visited your site before.
- Sessions: A session is a website visit. A user can visit multiple pages on your site during the same session. And they can come back tomorrow for a new session.
- Engaged sessions: Sessions that last 10 seconds or more, result in 2 or more page views, or result in a conversion event (like a form submission).
- Engagement rate: This is the percentage of sessions that are deemed ‘engaged sessions’.
- Average engagement time: Counted in seconds, this is the average time a user stays on a site or page.
- Views: This is how many times a page is viewed. A page can be viewed more than once during the same session.
- Views per active user: The number of times a page is viewed by the same user.
Is Page View Data Still Important?
During the earlier days of the internet, along with older systems for tracking data, pageviews were the end-all-be-all – the ultimate metric of success. But these days, pageviews have fallen down the ladder of importance. Why? Because with better tracking capabilities, tools like Google Analytics were able to shift to event-based tracking.
Valuable events, like form submissions and purchases, down to every click and scroll, are now tracked as events. Rather than just tracking pageviews, these new event metrics provide a clearer picture of whether users are taking the specific actions you want them to take.
Measuring What Matters
Under ‘Acquisition’ in the left-hand menu, the next large group of reporting capabilities falls under ‘Engagement’. As mentioned earlier in the article, GA4 is all about events. An event is anything that happens on a website. Some events like clicks, scrolls, page views and first visits are automatically tracked by GA4.
Website owners have the ability to take advantage of the extremely flexible nature of events to create custom events. This is how you can measure what matters. And it all starts with having clear goals for your business.
If you run a service-based business that relies on leads from your website, custom event tracking can be set up on your website forms, along with buttons pointing to the lead form, phone numbers, and email addresses.
If you’re selling directly to consumers on your website, custom events can be set up to track item views, chosen specifications, adding to cart, and entering shipping info. This data will help provide a better picture of the checkout journey, preference trends, and where users are dropping off.
To get help creating custom events and tracking special activities on your site, contact our digital marketing team.
Event Data
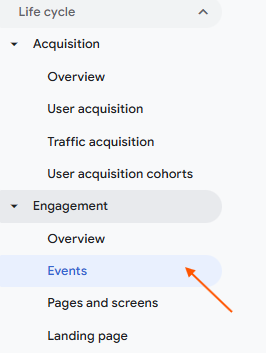
To view your event data, visit the ‘Events’ report under the ‘Engagement’ dropdown under ‘Life cycle’. All the various events and their names will appear in the first column. Here is some terminology to keep in mind as you peruse event and other engagement data:
- Event count: This is the total number of events tracked within the given timeframe.
- Key events: This is the total number of key events, which are just events that a website owner deems more important, like a purchase or form submission.
- Event count per active user: The number of events that occur per user.
- Key event count per active user: The number of key events that occur per user.
- Total revenue: You can assign dollar values to each event. In that case, total revenue will indicate how much money you’ve brought in during a timeframe.
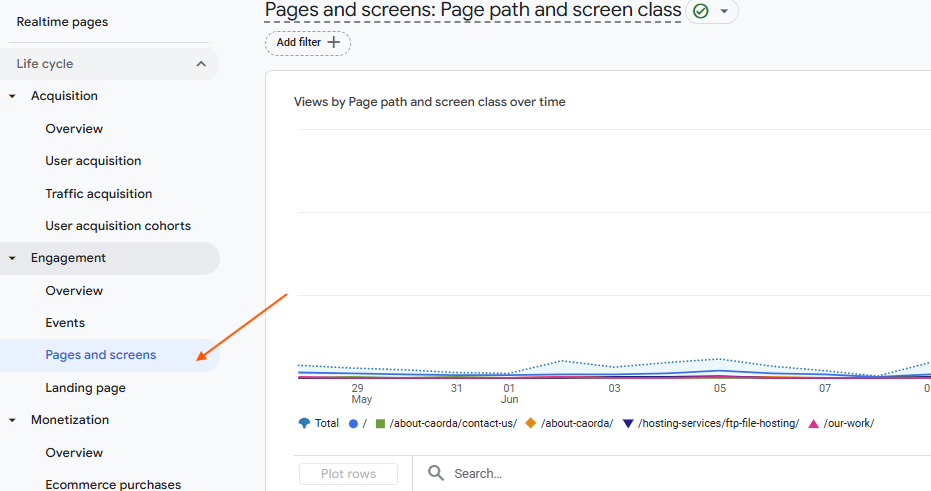
Page View Data
Moving on from events, the next report in the menu underneath the ‘Engagement’ dropdown is ‘Pages and screens’. This is where you’ll view a range of data related to your website’s pages.
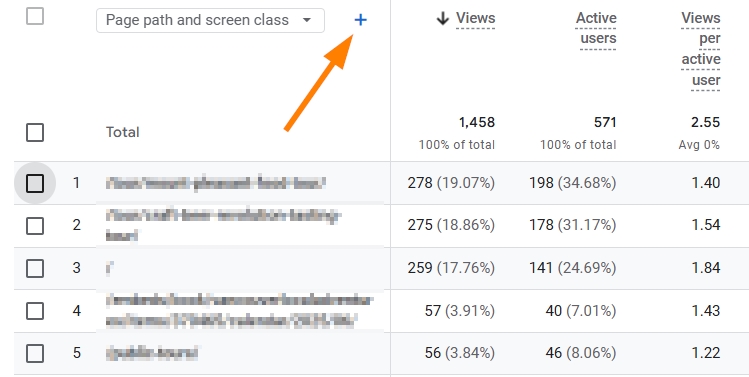
The ‘Pages and screens’ report will display a bunch of familiar metrics, such as views, users, engagement time, event count, and more. In the left-hand column, you’ll see the website pages. By clicking the dropdown on top of the far-left column, there are a couple of ways to view the website pages:
- Page title and screen class: This displays the page title of your website, a piece of metadata that can be changed by the website owner.
- Page path and screen class: The page path is what appears in the URL at the top of the browser.
*Note that ‘screen class’ and ‘screen name’ can both be ignored when looking at website data, as these refer to mobile app data.
As mentioned above, you have the ability to filter data for whatever dimension you would like by clicking the ‘Add filter’ button above the graph. By selecting a dimension and defining your conditions, you can declutter the data to look at something specific and find answers.
Are My Website Visitors Turning Into Customers?
Website traffic and events are great, but it’s not worth much unless your website users are turning into customers. If you’re selling products on your website, it’s relatively easy to determine when users make a purchase. But if you’re doing the selling off your website or in a physical store, that’s where the tracking gets tricky.
Events vs. Key Events
The first step to learning whether your website visitors are turning into customers is to understand the difference between events and key events. Key events are regular events that have been granted ‘key’ status by the administrator of your GA4 account (this could be you). Google will then factor in this ‘key’ designation to generate clearer reporting. Events deemed to be ‘key’ can also be imported into Google Ads, where the data will be used to optimize bidding strategies and measure the return on your investment.
The Final Stretch of the Customer Journey
When it comes to the final stretch of the customer journey, the business owner (you) will need to get involved. GA4 does not have access to your internal business details, so it’s up to you to weigh the data against what’s been tracked inside the business.
Information like customer details, purchase return rates, and lead conversion rates are all valuable metrics that can be uploaded into your CRM software. Using internal data cross-referenced with GA4 data, business owners will be able to calculate data like customer lifetime value, lead values, and lead generation goals.