
Internet stuff can be a bit daunting at times. This is especially the case if you’re not very technical and are trying to have a light conversation with a professional marketer. There is an inevitable smattering of lingo and jargon that might fly over your head like a swallow fleeing a falcon.
SEO, Google Serps, CTA’s, conversions, click-through rate, bounce rate, backlinks, referrals, yadda yadda yadda.
It can get a bit messy, but there are a few things that you can do on your own to help improve how your website works. You just need to know where to look.
For this, let’s take a look at Google Analytics. We’ve put together a few pointers that you can use today to start measuring how your website is performing. These are meant to be somewhat ‘high-level’ and geared towards the novice Googler. As always, we’re here to help. If there’s anything listed here that you’d like to learn a little bit more about, please get a hold of us; anytime.
Hello, Google Analytics
This might seem like an obvious place to start, but in our experience, it often overwhelms people and that’s not much help at all. If Caorda built your website, we likely signed you up for Google Analytics in case you weren’t already tracking. Don’t’ remember? Ask us! We may just need to grant you access. Google Analytics gives you wonderful information about how people are using your website; the trick is knowing where to look. Here are a few of my favourite starting points for getting the most out of Google Analytics. Please follow along.
For these areas, start at the navigation at the top left of your Google Analytics Dashboard. Follow along by clicking each item as it expands the menus.
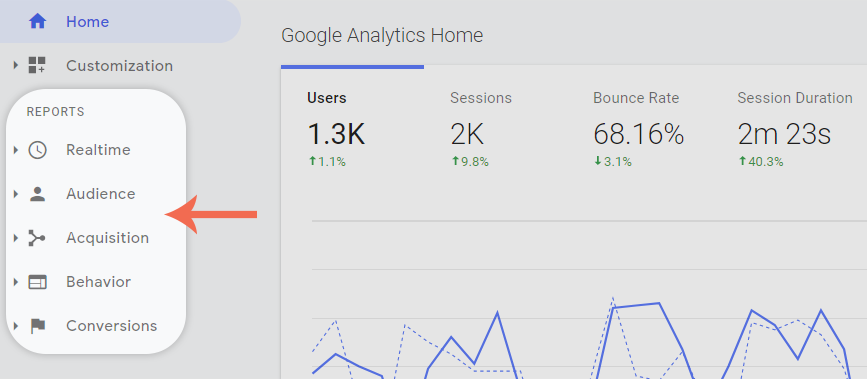
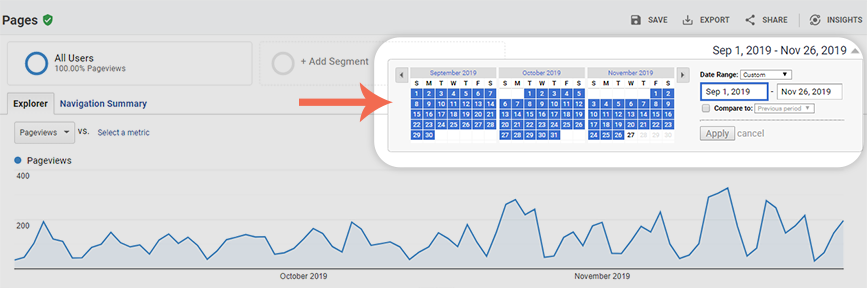
Before you start, set your date range to at least 30 days to get a good mix of visitor information; go for 3-6 months for really great data.
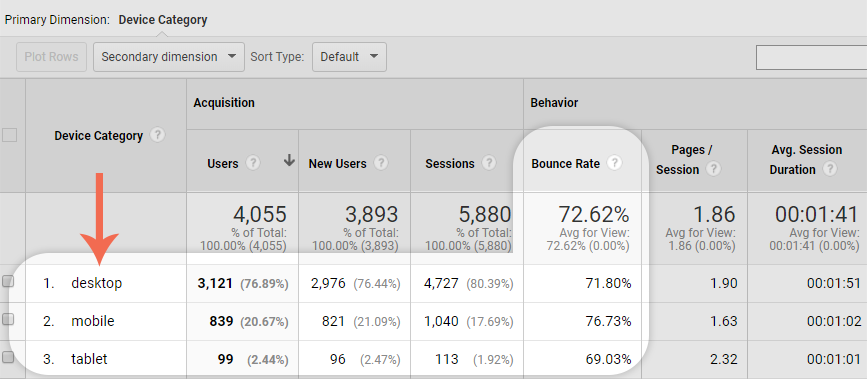
Mobile Device Overview (Device Type)
Click > Audience > Mobile > Overview
Use this chart to see how many people arrive at your website from their phones vs desktop vs tablet. This helps you to justify investing time into the mobile experience of your website. Take note of the ‘Bounce Rate’ for each device. This could be a sign that you’re not quite communicating with people on one device or another. Anything over 50% might encourage you to take a fresh look at your web design or content.
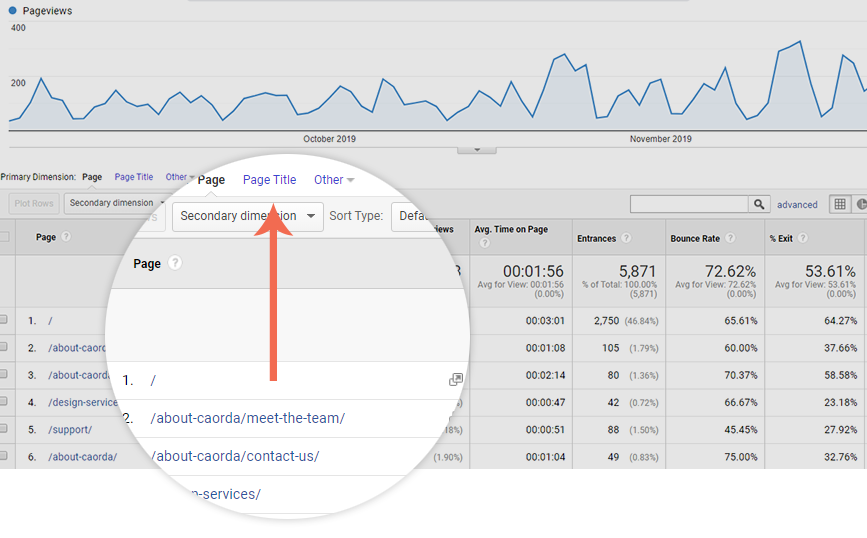
Most Viewed Pages (Bounce Rate, Exit Percentage & Page Titles)
Click > Behavior > Site Content > All Pages
Use this chart to discover your most popular pages. But not just that, look at the other columns in this table. In particular, Bounce Rate, Exit Percentage and Page Titles.
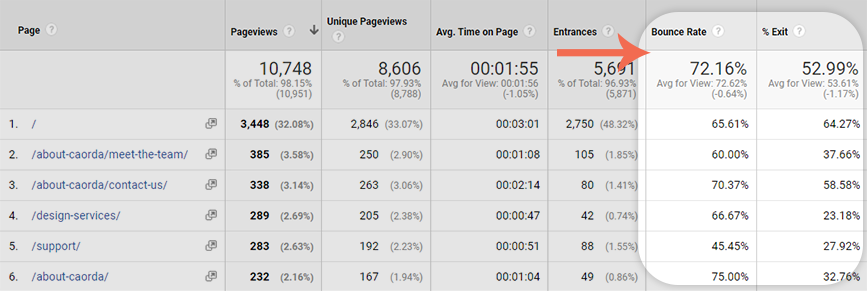
Bounce Rate
A ‘bounce’ occurs when there is an extremely short visit to the page where the visitor did nothing and went back to their Google Search (usually). This will give you a sign that you might want to improve the relevance, content, design, or add a couple more ways that people can click through to other related pages (Calls-to-Action).
Percentage of Exits
The Exit Percentage is the percentage of visitors that exited the website from this page. So, an Exit Percentage of 37% on your about page means that 37% of people that visited this page, left the website from this page. Got it? Good! If not, that’s okay, it’s a bit of a funky stat. It doesn’t necessarily mean that the page is performing badly, but it’s just another signal to use when optimizing the website content and experience.
Page Titles
This is a lesser-known report in Google Analytics, or at least I’ve not seen people referencing it very often. This chart has info that, when used to strategically optimize your webpages, it can have a decent effect on your Google Rankings and Google traffic. Just above the list of pages is the Primary Dimension setting that defaults to Page. Click to the left of Page, onto Page Title and check out the updated list.
This is another one of my favourite charts since it gives you an ‘at-a-glance’ view of how your pages might show up in Google Search results (The SERPS). As we know, the Page Title is most often used as the clickable link in the search results.
Like this:
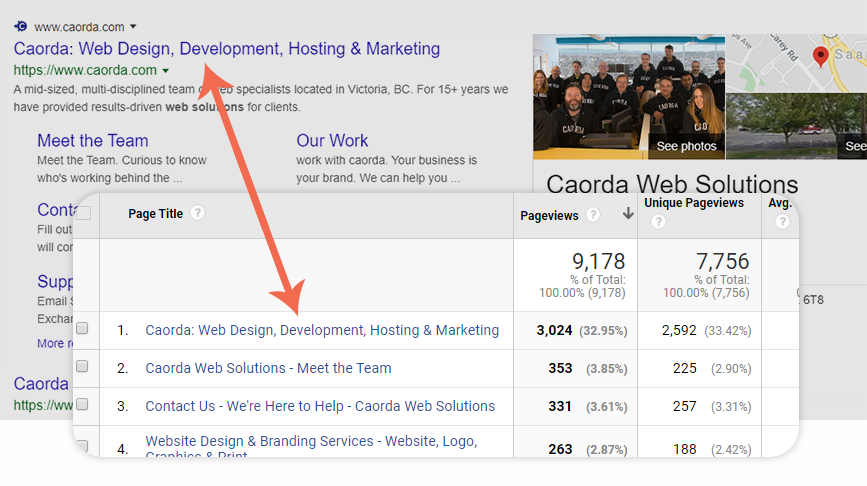
Scan down your list of Page Titles and look for any that aren’t clear and descriptive using your main keywords. Pay particular attention to your services or product pages. An item to look for is that you shouldn’t see your brand name at the start of every Page Title. Or even at the end for that matter, as Page Titles are so valuable. You will never need to ‘optimize’ for your brand name (there are a few exceptions), so try to move your name out in favour of quality keywords and phrases.
A Bonus Thing!
I’ll leave you with one last little trick in Google Analytics. This will set all the reports to show you only Organic traffic that came from search engines. This is really helpful when you’re trying to hone in on areas to improve the experience for anyone finding you from Google (or Bing for that matter).
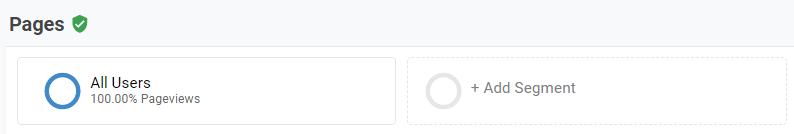
At the top of nearly every page is the User Segments selection. This defaults to All Users which include every single person who visited your website. This could be from Google, Facebook, email clicks or people who typed your domain directly into their browser.
Click on Add Segment and look for the Organic Traffic segment in the list; click it. Then, look for the down arrow beside All Users and hit remove.
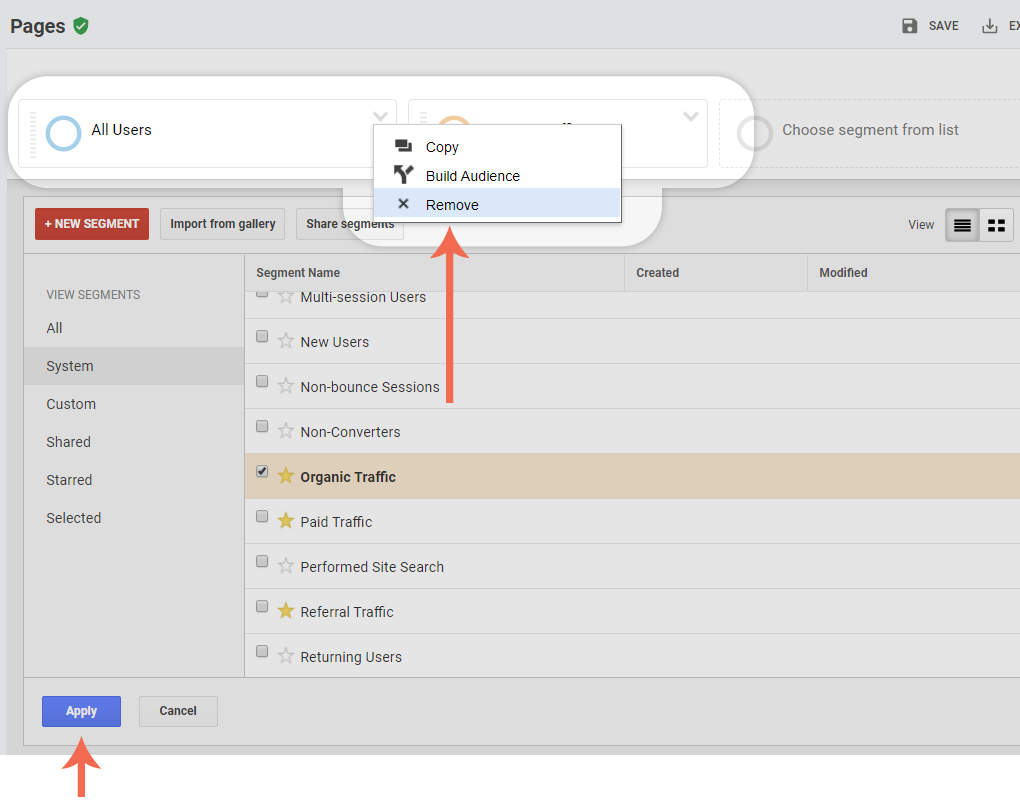
Don’t forget to apply the changes; the button is at the bottom of the segments list. Now every report that you’re looking at is strictly Organic traffic that arrived by Google, Bing, etc… Recheck all of your charts from above and note any differences. There should be some noticeable changes to the top pages and other data.
Endless Numbers
There is a seemingly endless stream of information in Google Analytics. It can be overwhelming and most of us barely scratch the surface of what’s available. For the basic user, this might be all you need to get a general idea of the health of the website. However, the most important thing to remember is the data is there to help you measure the performance of your website. First, you need to give yourself a plan and set a goal. Something like, “I want to reduce the bounce rate site-wide by 5%”. Then you can focus on those stats that show you the specific pages or areas of the website that could use the most help. You might find you’ll hit that 5% quickly with some design improvements and content updates.
It’s incredibly exciting when you see improvements from work you’ve completed based on a strategic plan. Google Analytics is an excellent first step towards helping guide you in recognizing then acting on areas of your website that are the most meaningful to your visitors. It’s very important to always use feedback and signals from your visitors to improve your website. As hard as it may sound, you’re the worst person to user test your own website. ?? It’s the truth.
The next free tools we’ll try to get comfortable with are the ‘Google Power Couple’ of Google My Business and Google Search Console. These are the 2 most powerful free Google Search tools on the ‘interwebs’ in my humble opinion. Stay tuned for a Caorda article on these 2 internet beasts in the next few weeks.
I hope you were able to understand these tips described above and can put them into practice right away! If you have any questions whatsoever, we’re just an email away.